M2 Recovery#

Overview#

This procedure should be done when MTM2 goes to FAULT and exits the closed-loop state.

This step-by-step guide is the integration of the Recovery system at night and Restart control system procedures

Information

MTM2 possible states or control modes are Idle, TelemetryOnly (Disabled), Open Loop, Closed Loop. Each state is indicated by an integer from 1 to 4.

You can check the MTM2 state in Chronograf dashboards M2 state, MTM2 dashboard or LOVE view, once you are signed in.

A GIS interlock prevents TMA movement if MTM2 is not in the closed-loop state.

../../../../_images/MTM2-recovery-M2-states-in-chronograf.png

MTM2 states in Chronograf#

Important

MTM2 should always be in the closed-loop state (state 4) for the safety of the glass.

Note

Any fault in MTM2 is worth ticketing, this is not a system that should reach a FAULT state easily.

Error diagnosis#

MTM2 CSC goes to FAULT and exits the closed-loop control (check M2 state).

../../../../_images/MTM2-recovery-MTCS-M2-FAULT.png

MTM2 CSC in FAULT state#

Follow these instructions to investigate the state of MTM2 and identify the cause in the Chronograf MTM2 dashboard.

Check the following items:

  1. Power Current:

    This will indicate when MTM2 exited the closed-loop state (as shown in the image below, the magenta line sharply drops at approximately 19:38).

    ../../../../_images/MTM2-recovery-power-current.png

    MTM2 Power current#

  2. TMA Elevation Position and Elevation Angle measured by M2:

    To ensure that they are at the same position after exiting the closed-loop state (note time displacement in plots).

    ../../../../_images/MTM2-recovery-elevation-by-M2.png

    MTM2 Elevation position#

  3. Tangent Fault:

    It may indicate excessive forces were the cause of the fault.

    ../../../../_images/MTM2-recovery-tangent-fault.png

    MTM2 Tangent fault#

  4. Log Message:

    It may display useful information about the cause.

    ../../../../_images/MTM2-recovery-log.png

    MTM2 Log message#

Note

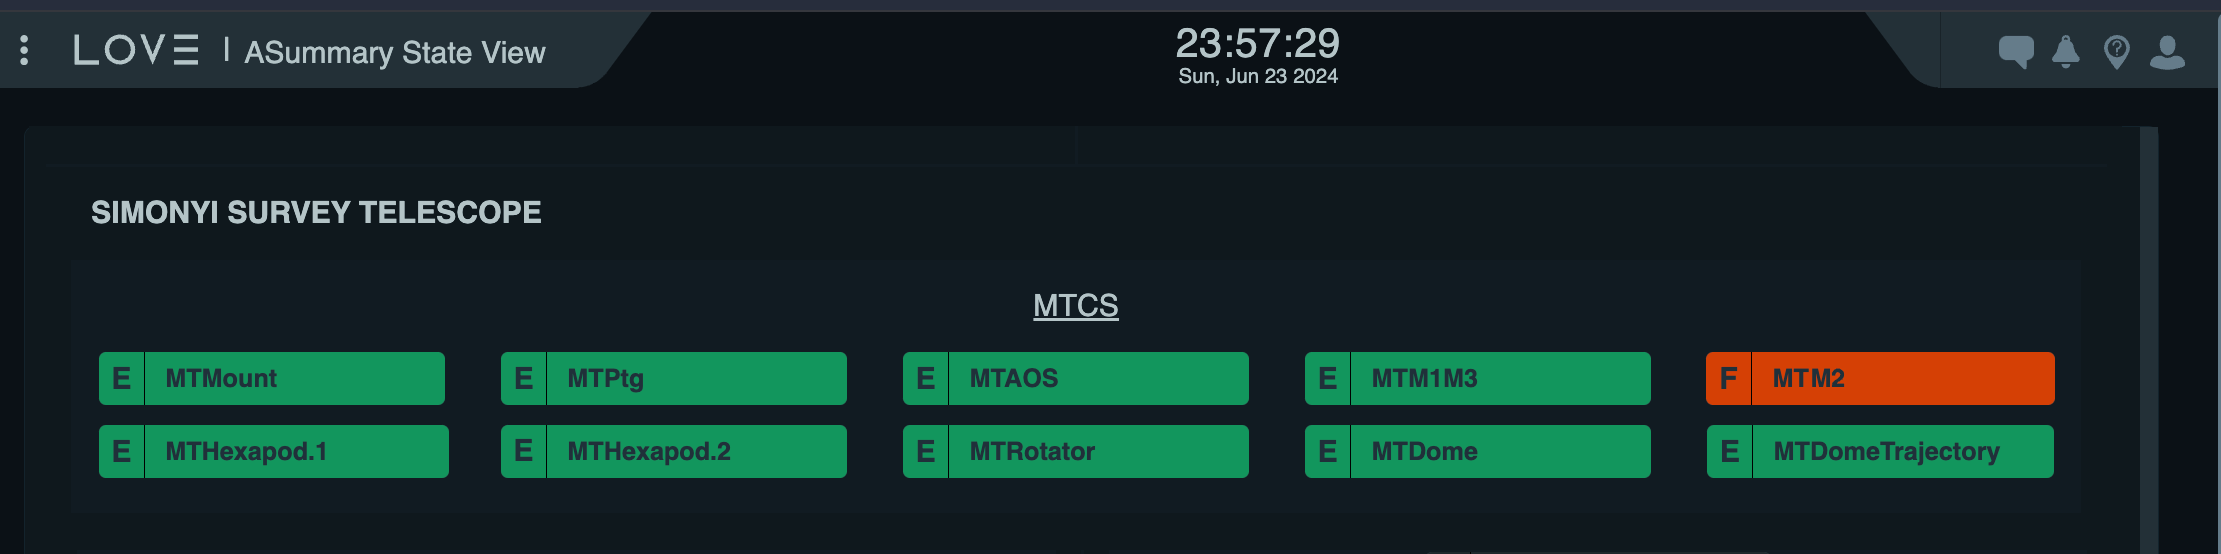
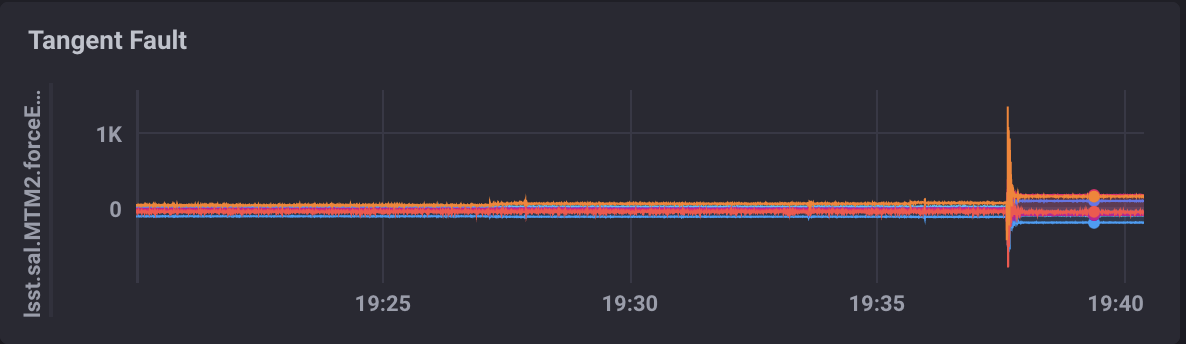
Log your observations on the cause and add comments to a Jira ticket (either existing or one you create). Include any unique activities occurring when the fault happened, (c.f. OBS-416) as MTM2 is not expected to fault.

Procedure Steps#

  1. Restart control system.

    Warning

    This step must not be skipped. Restarting the control system acts as a catch-all for resetting issues. Failing to do so may also cause issues with telemetry.

    1. Connect to the admin user on M2 cRIO controller via ssh using the username and password found in 1password MainTel vault.

      Note

      There are 2 cRIO controllers in the summit:

      • m2-crio-controller01.cp.lsst.org

      • m2-crio-controller02.cp.lsst.org

      Depending on the location of M2, run the command:

      If M2 is at the TMA:

      ssh admin@m2-crio-controller01.cp.lsst.org
      

      If M2 is on level 3:

      ssh admin@m2-crio-controller02.cp.lsst.org
      
    2. Stop the control system and wait 3 minutes using the command:
      /etc/init.d/nilvrt stop
      
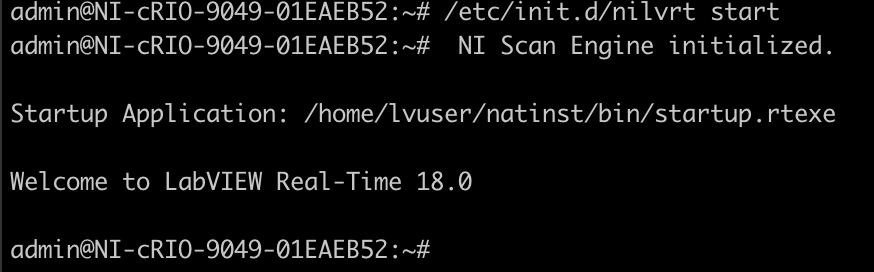
    3. Start the control system and wait 3 minutes using the command:
      /etc/init.d/nilvrt start
      

      You may press enter to regain your shell prompt when you see the following “Welcome to LabVIEW Real-Time 18.0”.

      ../../../../_images/MTM2-recovery-restart-control-system.png

      Restarting MTM2 control system#

  2. Reset the M2 interlock signal in GIS main cabinet on level 2, even if the state is “OK”.

    Important

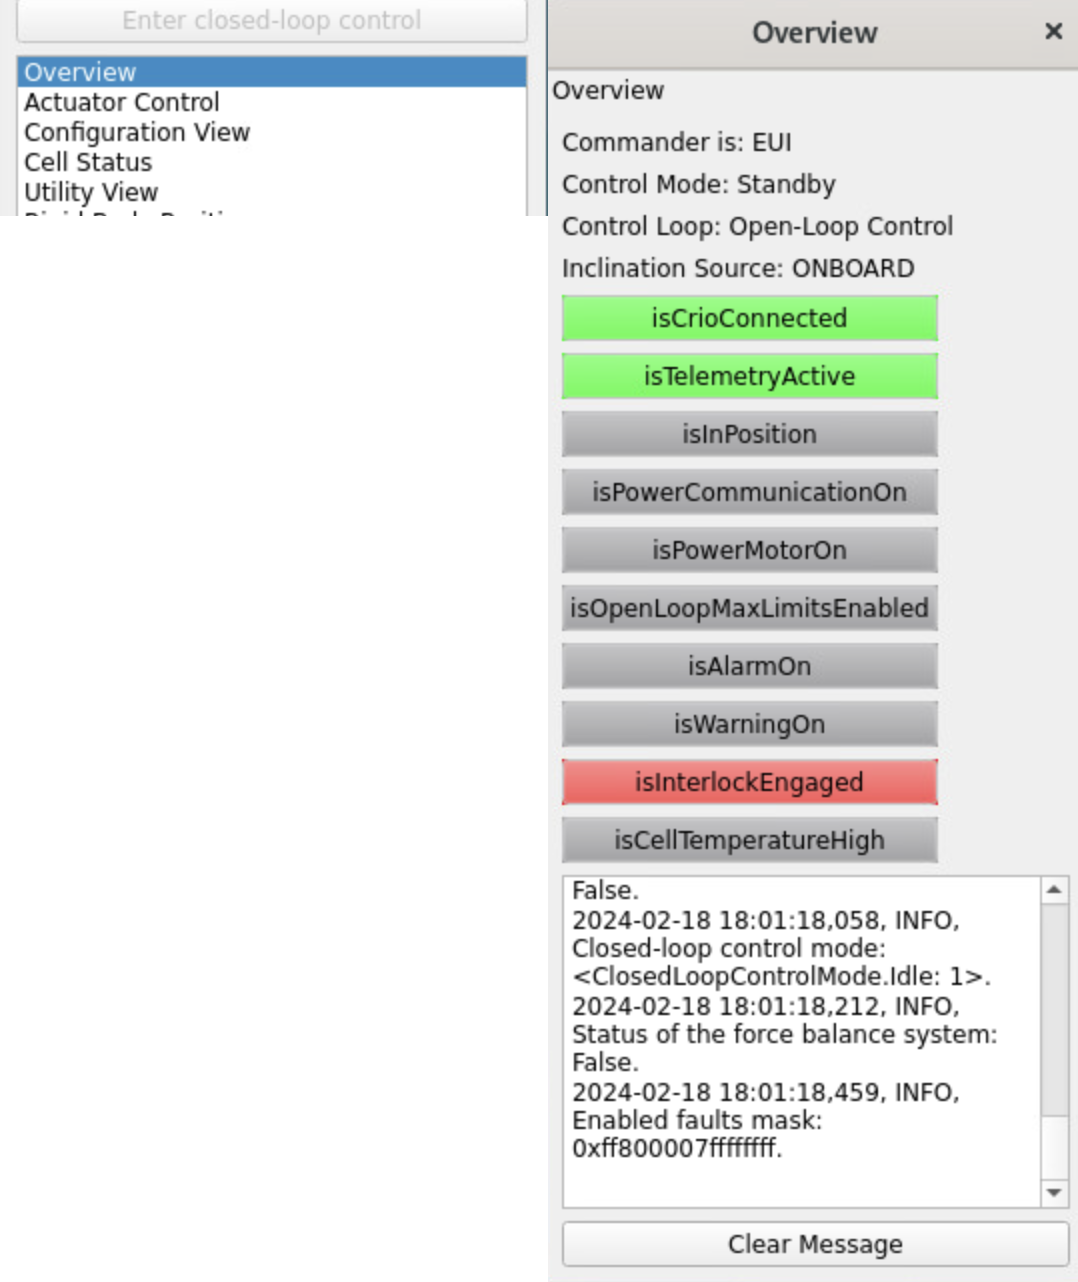
    Note that all status boxes for the M2 actuator will appear green. This indicates the status of the relay that enables power to the systems, not the status of M2 itself. Therefore, after an interlock or power cycling, it is necessary to press the RESET button.

  3. Use python EUI/GUI to change MTM2 to closed-loop state:
    1. Open the MTM2 EUI. Follow instructions to access the MTM2 EUI.

    2. Establish local control by pressing connect, then local.

      Note that local may be greyed out after connecting, this is normal.

      ../../../../_images/MTM2-recovery-GUI-open-connect.png

      MTM2 GUI open and connect#

    3. Pull up the Overview widget by double-clicking on Overview in the list at the bottom of the EUI.
      ../../../../_images/MTM2-recovery-GUI-overview.png

      MTM2 GUI Overview#

      1. Check the Enabled Faults Mask.

        It should not be 0. If it is, repeat Reset the M2 interlock signal.

        Note

        It is ok if the isInterlockEngaged indicator is red.

      2. Look at Alarms/Warnings widget to see active alarms (red) or warnings (yellow).

        If active, reset them with Reset All Items.

        Make sure you have removed the fault condition.

        ../../../../_images/MTM2-recovery-GUI_alarms-warnings.png

        GUI Alarms and warnings widget#

        If Reset All Items does not work, you maybe have to power cycle M2 cabinet. Only do this if there are no other options!

    4. Switch to Diagnostic mode. Be patient; this may take some time.

    5. Switch to Enabled mode. This may take up to 2 minutes. If this step fails, you may have to repeat Reset the M2 interlock signal instructions.

    6. Enter closed-loop control.

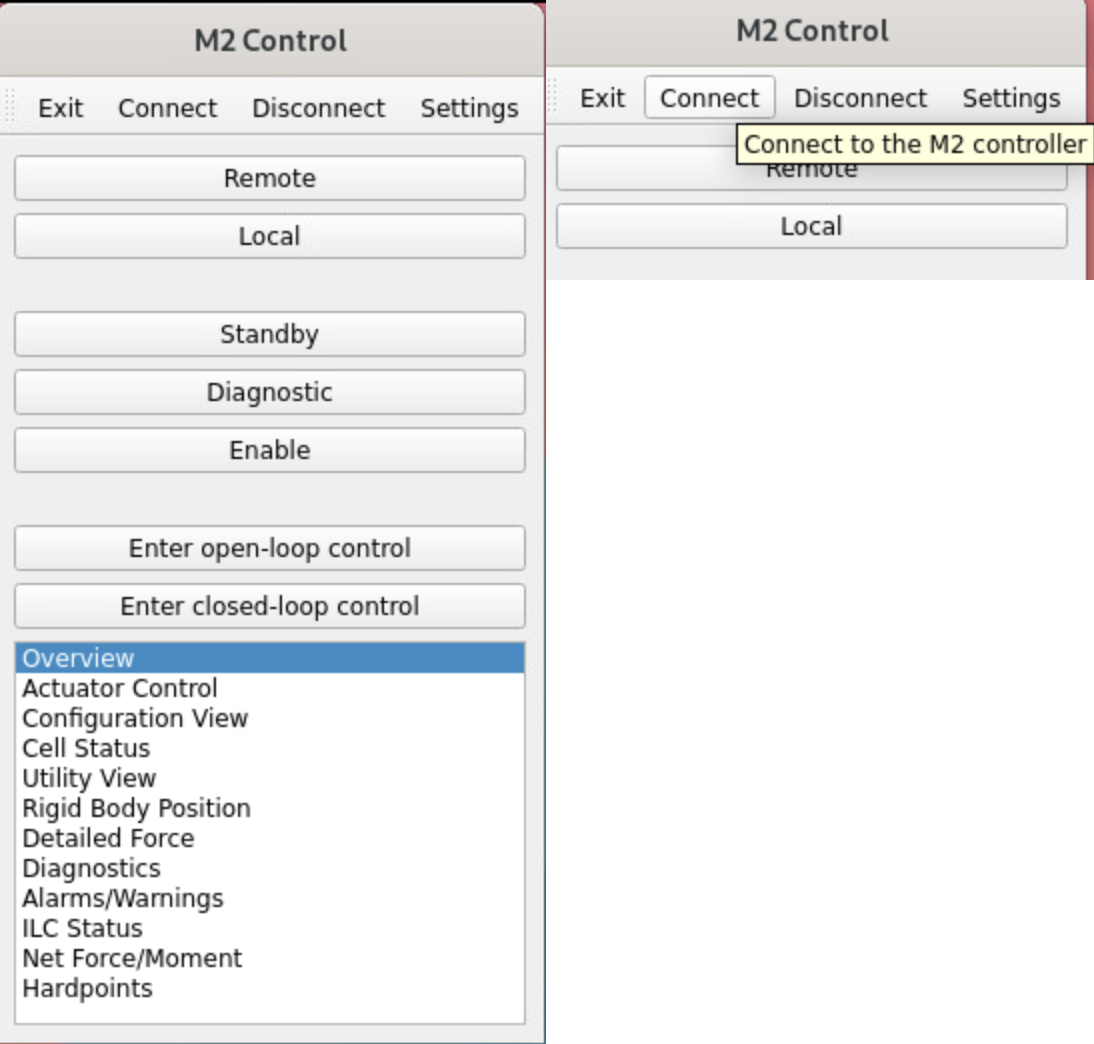
  4. Return to Standby mode in the EUI to close the GUI by pressing the following buttons:
    1. Enter open-loop control.

    2. Diagnostic mode, this usually takes ~30s.

    3. Standby mode, this usually takes ~30s.

    4. Remote mode, to allow CSC control of M2.

    5. Disconnect EUI on the top tool bar, this usually takes ~30s.

    6. Exit on the top tool bar.

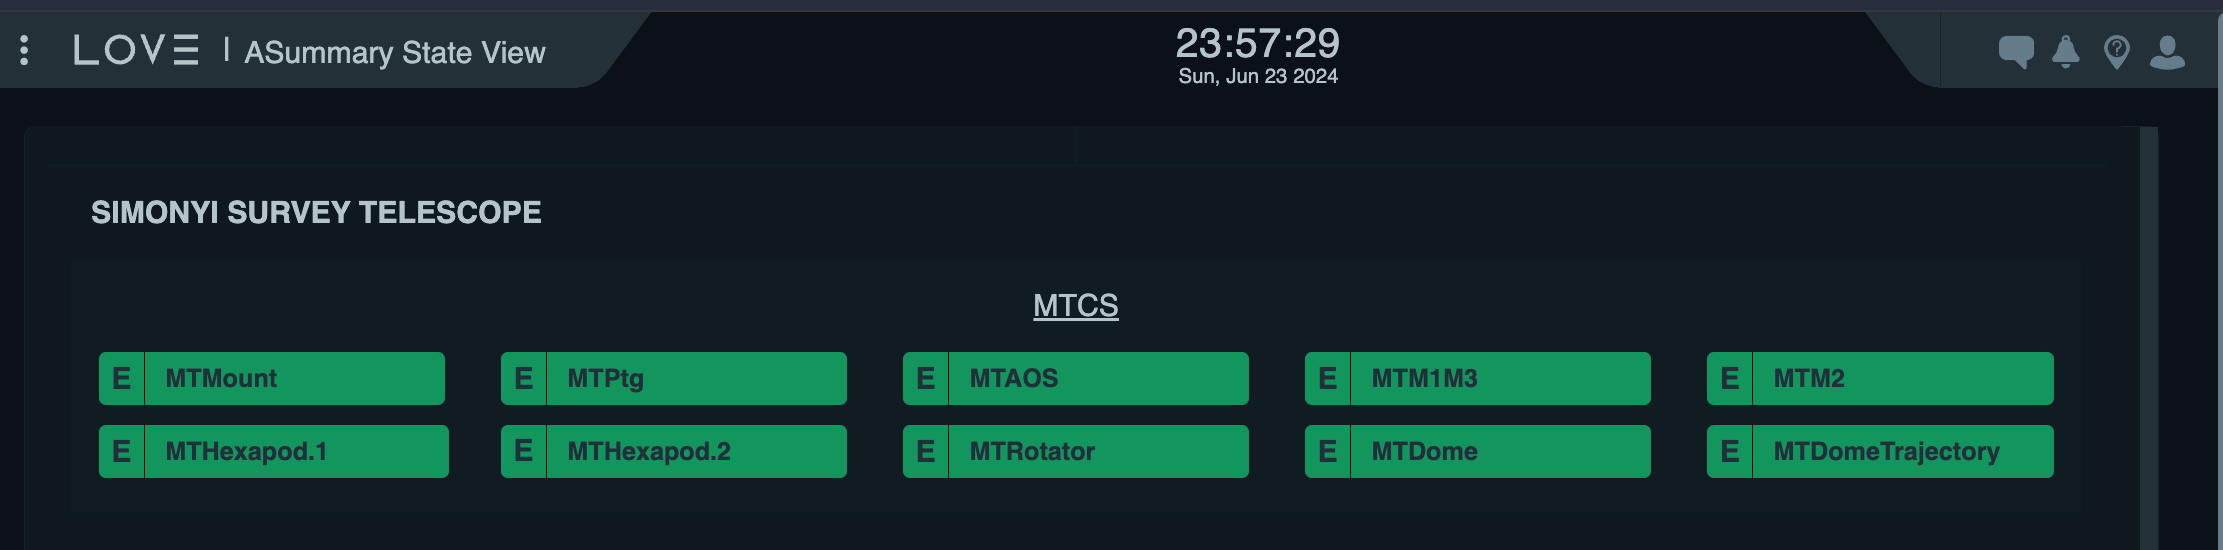
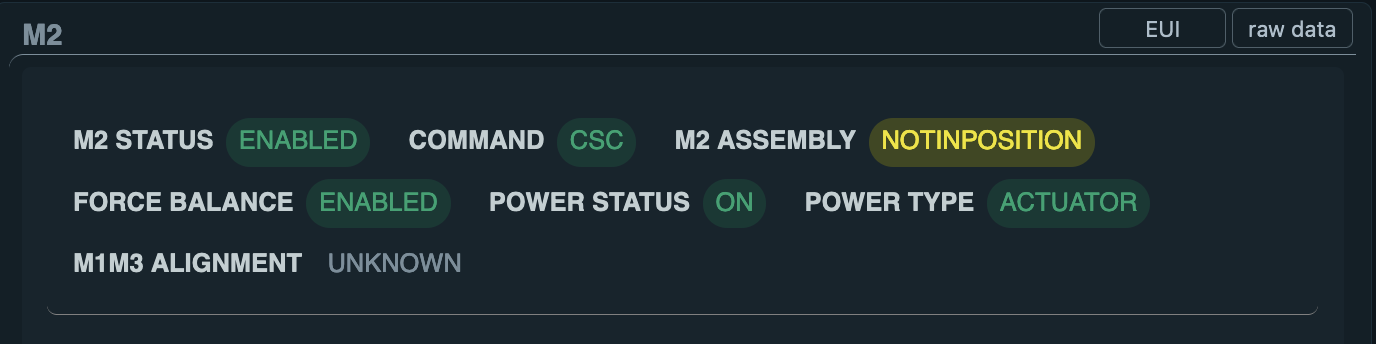
  5. Change the status of MTM2 CSC from DISABLED to ENABLED.

    If the attempt fails, try again, but first set it to STANDBY. Each transition is expected to take approximately 2 minutes.

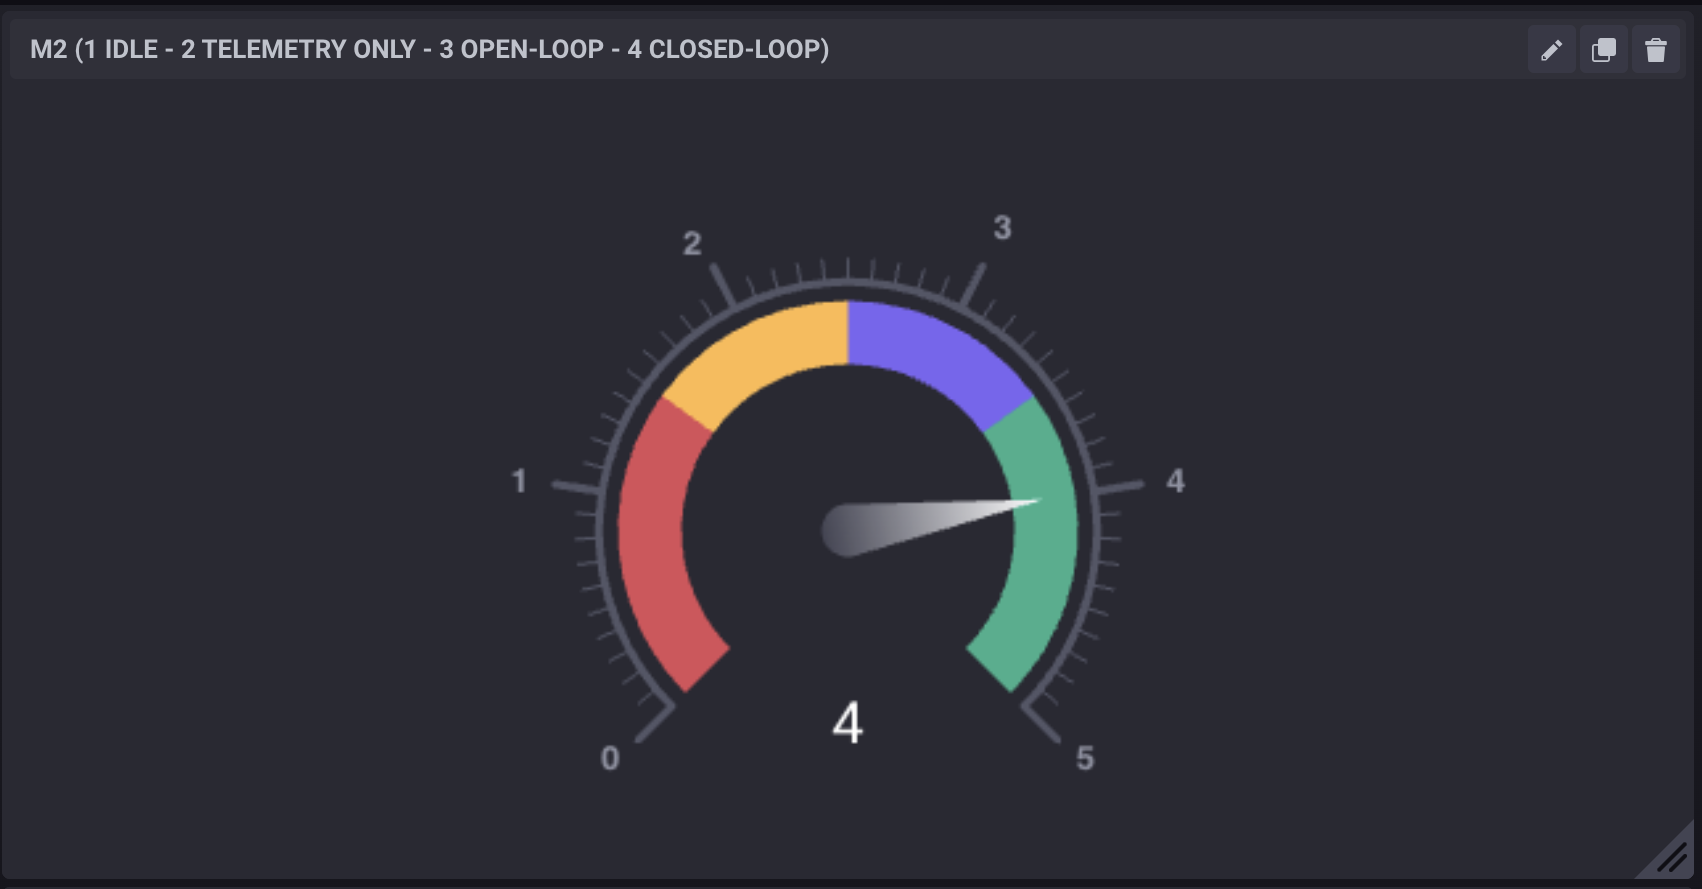
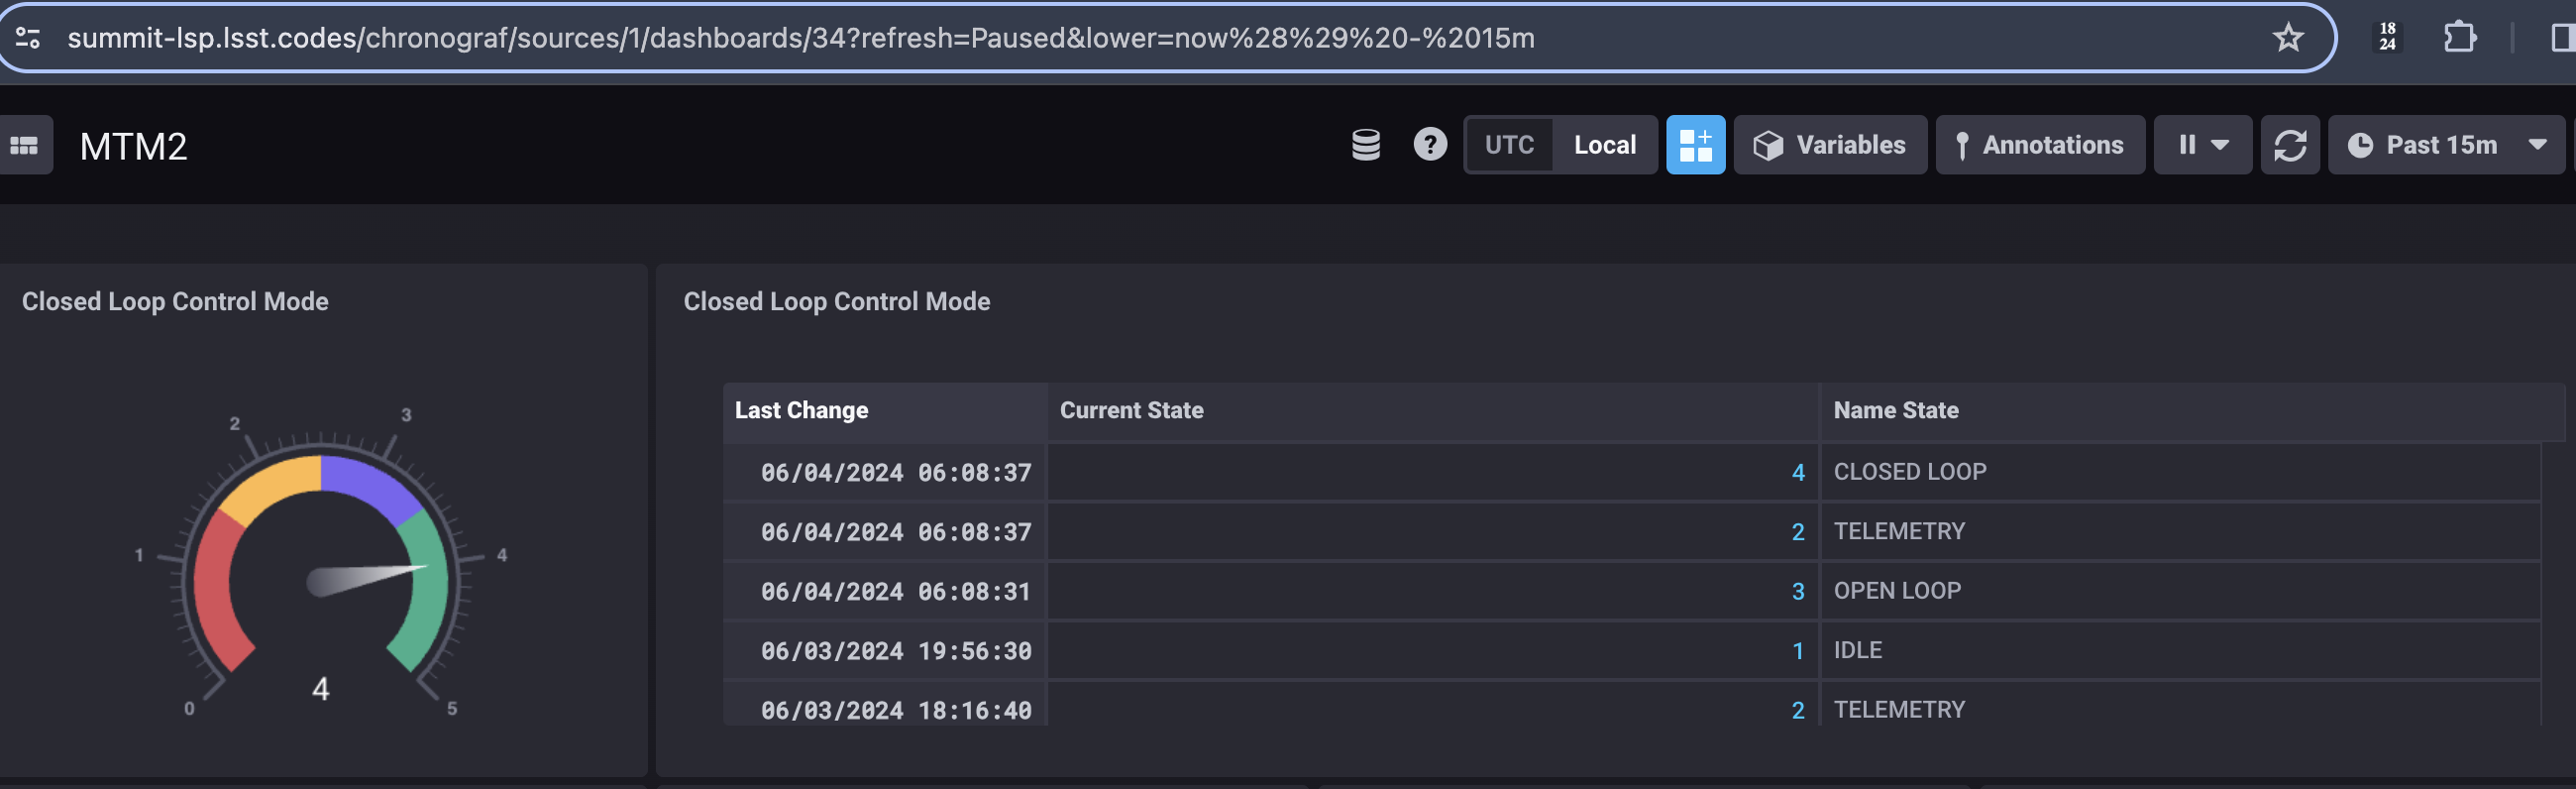
  6. Check that M2 in under closed-loop control 4 in Chronograf M2 state.

    If needed, set closed-loop control by running the script standardscripts/maintel/m2/enable_closed_loop.py, without configuration. This can be done even if you are already under closed-loop control.

Post-Condition#

  • MTM2 is in ENABLED state.

  • MTM2 is in closed-loop state (4).

    ../../../../_images/MTM2-recovery-MTCS-all-enabled.png

    MTM2 CSC in ENABLED state#

    ../../../../_images/MTM2-recovery-M2-state-chronograf.png

    MTM2 state in closed-loop (4) in Chronograf#

Note

There will be an indicator added in the MTM2 LOVE view (see that it is missing in the image below), check LOVE-300.

../../../../_images/MTM2-recovery-LOVE-M2.png

MTM2 display in LOVE#

Contingency#

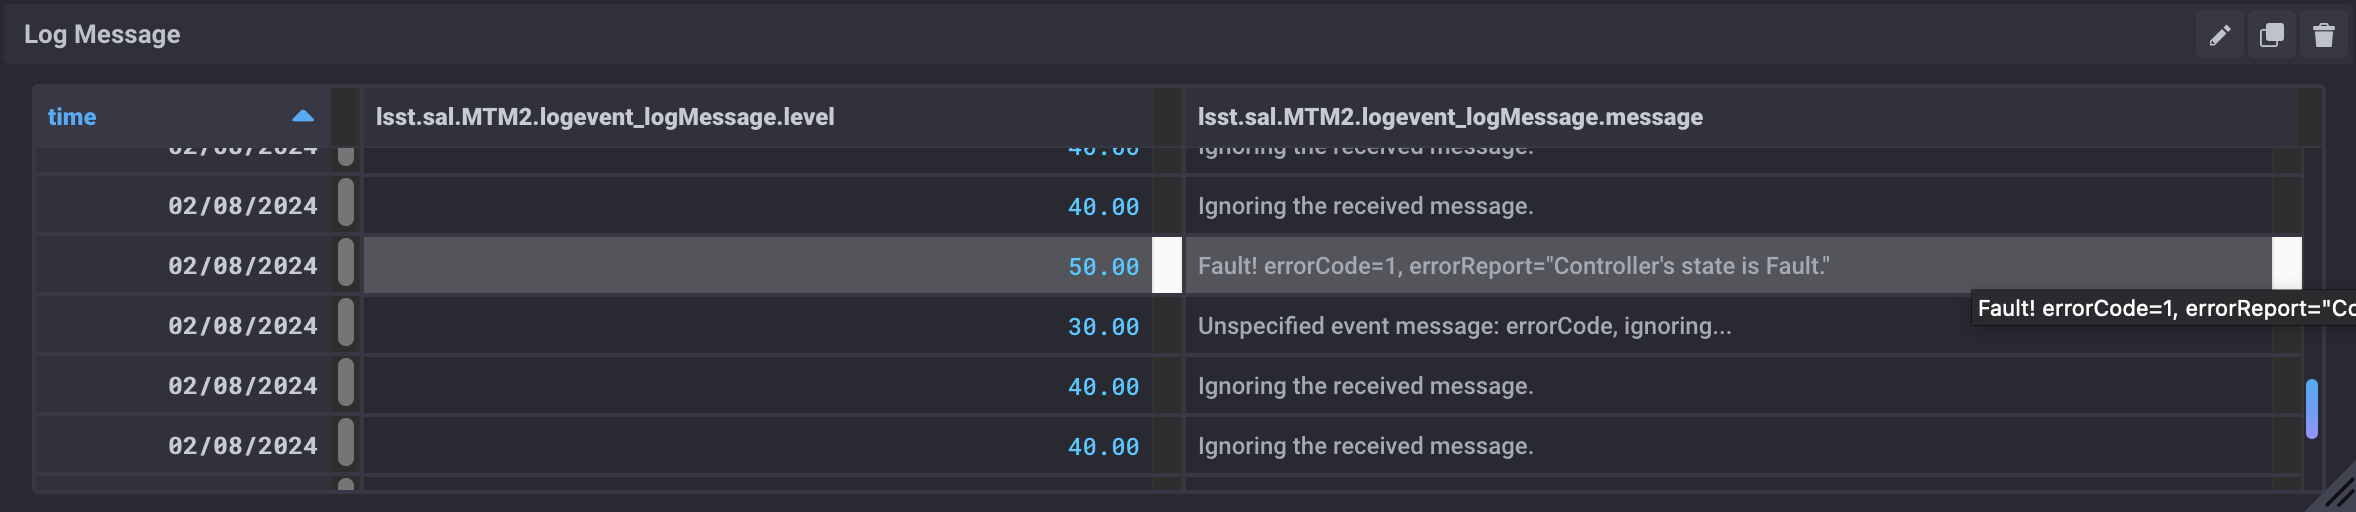
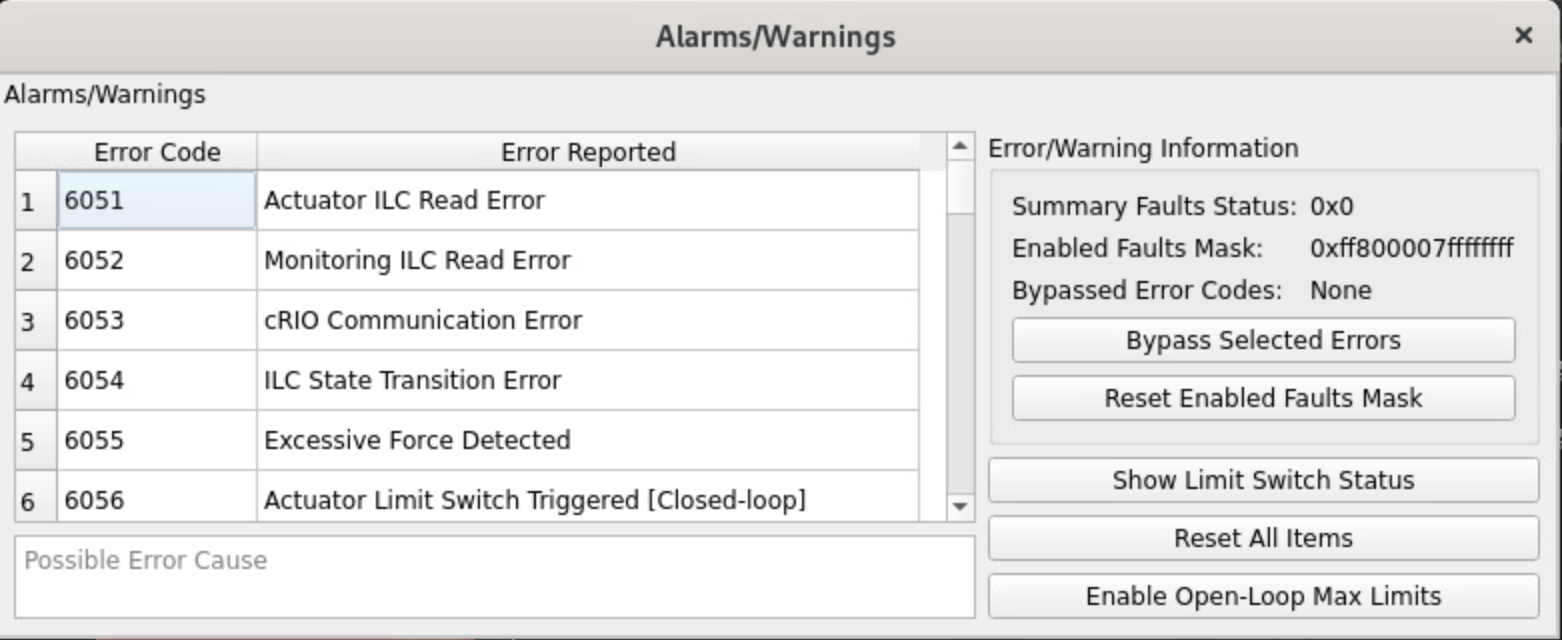
If you are unable to find the fault, 
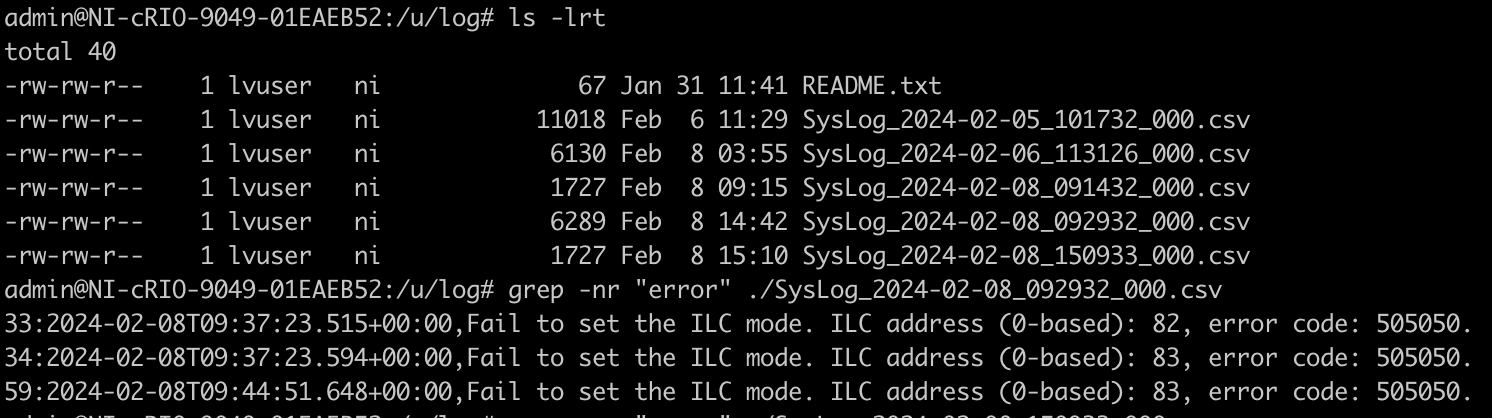
check the cRIO controller log that contains detailed report faults. These logs are found in the /u/log/ directory.

  • Use the command ls -lrt to list logs, with the most recently modified logs displayed at the bottom. Logs are named according to their creation date and time.

  • Grab error messages from the log with a command like grep -nr "error" name_of_log_here

    ../../../../_images/MTM2-recovery-log-cRIO.png

    Checking the cRIO log#

Get information from log

ls -lrt # list times in directory, in a list, sorted by time, in reverse order (newest on bottom)
grep -nr "error" {logname} # List lines from file {logname} containing error
cat {logname} # print the log file to terminal, sometimes these are short and in the event of a fault, interesting lines are at the bottom

If the procedure was not successful, report the issue in #summit-simonyi and/or activate the Out of hours support.