Monitoring LATISS Disperser Wheel Position
Overview
When night observing with AuxTel, it is important to check that the grating linear stage in properly aligned to allow proper dispersion of the diffraction orders across the CCD. This check is especially critical if the ATSpectrograph cRIO has been reset recently as the reset may result in mechanism timeouts or miscommunication. During normal operations, the position of the disperser wheel can be monitored with telemetry from Chronograph or LOVE. However, when the cRIO is reset and the linear stage is in the forward position, it is possible that the reported position may not be reliable. Therefore, it is important to validate the position of the linear grating stage independently from the telemetry.
Precondition
The telescope is currently on-sky and running the scheduler.
The linear stage position telemetry displayed abnormal values some time within the past 24 hours. For example, a reported position of -324mm may occur when there is a reset (see Fig 1).
The allowed range of measured positions of the disperser wheel is 0-67mm (software limit set at 67.5mm).
Important!
If there has been a recent cRIO reset within the past 1-2 weeks, this procedure should be performed as a consistent nighttime routine.
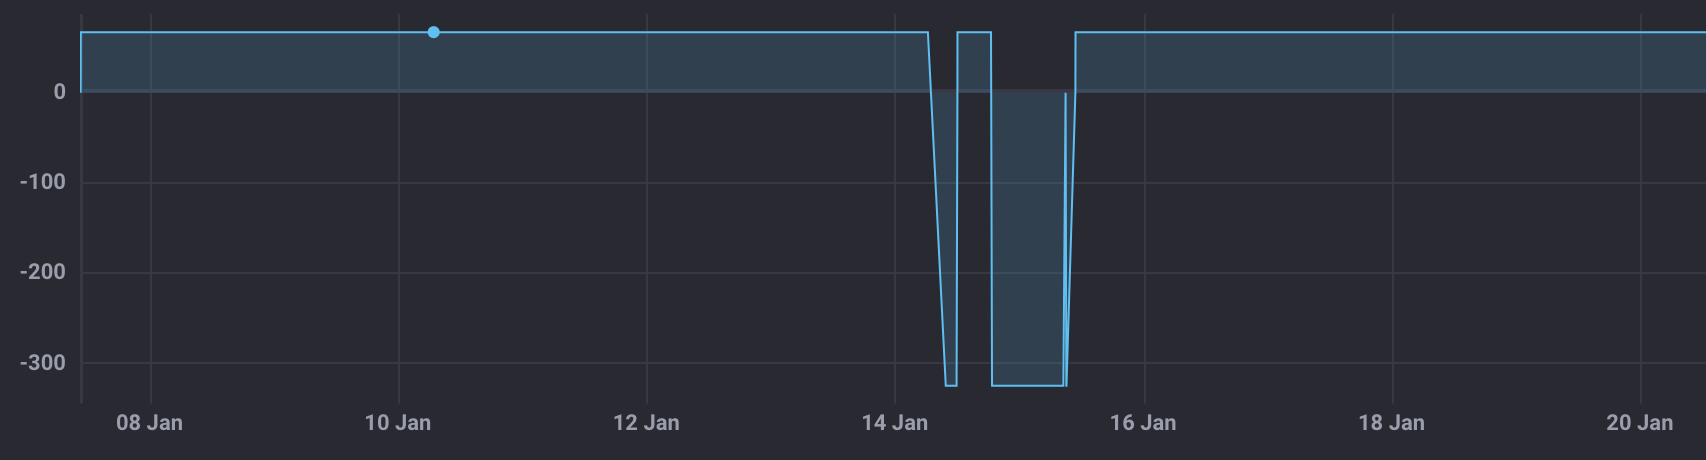
Fig 1: Example plot of cRIO reset (Jan 14th - Jan 16th)
The position of the disperser wheel can be monitored using the following code on Chronograph:
SELECT "position"
FROM "efd"."autogen"."lsst.sal.ATSpectrograph.logevent_reportedLinearStagePosition"
WHERE time > :dashboardTime:
AND time < :upperDashboardTime:
Post-Condition
The disperser wheel is (re)aligned to its nominal position of 67mm.
The CCD disperser coverage has increased, resulting in a higher resolution of the AuxTel spectral data.
Procedure Steps
Access RubinTV and navigate to the AuxTel image display page.
At the beginning of night observations, select the spectrum from a sequence number with the following characteristics:
Sequence Number Characteristics
Image Type: science
Filter: empty
Grating/Disperser: holo4_003
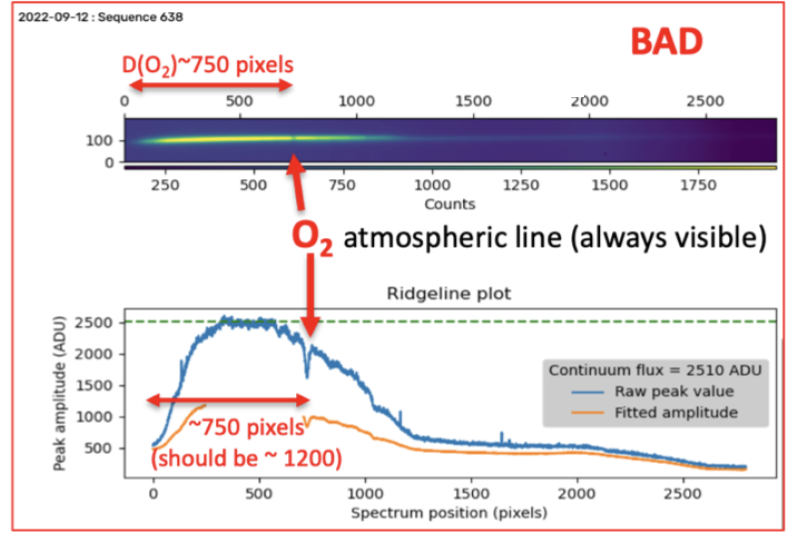
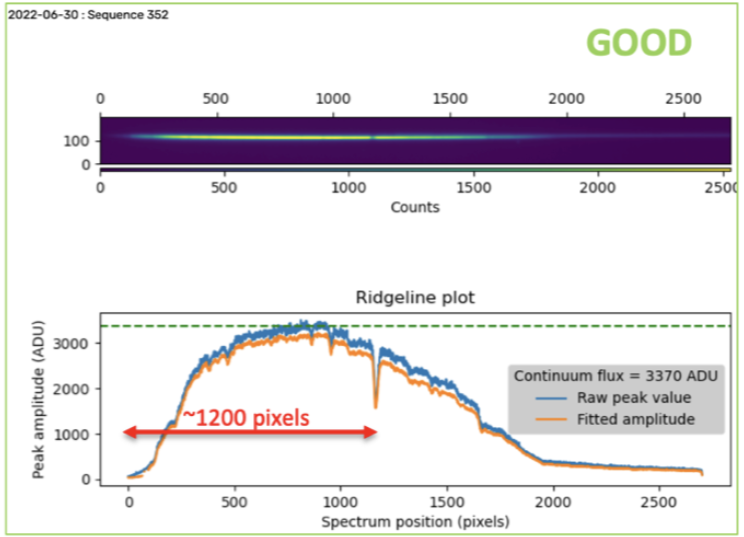
Locate the large atmospheric absorption line due to oxygen (\(\lambda = 762 \, \text{nm}\), see Fig 2).
Estimate the distance in pixels from the beginning of the spectrum to the peak of the absorption line. Label this value \(D(O_2)\).
Compare the estimated value with the expected value \(\boxed{D(O_2) \sim 1200 \pm 100 \, \text{pixels.}}\)
|
|
Note
The oxygen absorption line is always visible, but may be difficult to locate for certain spectra. Make sure to verify noticeable absorption profile characteristics (line width, depth, etc.) is present in the 1D spectrum (Fig 2 bottom panels). If it is too difficult to identify the line in both spectra then try another sequence.
Troubleshooting
If the distance is smaller than expected (see Fig 2), rerun
latiss_checkout.pyin the ScriptQueue. This script will automatically attempt to reposition the grating stage.Once the script has finished running, verify again that the spectrograph is properly positioned.
- If the issue has not been resolved, proceed to the instructions on